
The HNS Schema – On Paper
The subject “Neuronantomy” was feared by generations of medical (dental and paramedical) students. Few anatomy teachers specialised in neuroanatomy. Students had access to the usual textbooks with various sections of the brain and spinal cord], and special atlases of the central nervous system.
My aim was to try and simplify the representation and naming of the key elements of the CNS.
In 1985, I devised a Graphical Schema which I translated into a computer-based browsable schema in 1986.
This was through simple analysis and serial iteration to represent the (fewest) principal elements of the human nervous system: composed of some 21 principal elements. These effectively “encapsulated” the complexity of the system – where the schema elements (graphical objects) were effectively “containers” for detail. Interpreted as an interactive computer-based graphic, the Schema was designed to be “browsed” and objects of interest selected (“interrogated”) and when selected (with a mouse pointer) linked to detail/semantic textual names/definitions etc.
On paper, the Graphical Schema was a static ‘map’ – festooned with text labels and lines joining labels to schema parts.
The HNS Computer-Based “Browser”
The idea of the computer-based “browser” was that the Schema would be depicted/displayed on the screen – composed of individual graphical elements (in a bilaterally symmetrical array) each element a graphical symbol representing a key structural/functional element/category. Each graphical element hyperlinked to definition, detail and reference.
The vision was of a computer-based Schema – a “Browser” – which could be “interrogated” element by element e.g. to interrogate a List of Labels – to actively construct the graphical schema or conversely, to interrogate a Graphical Schema to actively construct a List of Labels – either/both graphical elements and/or labels to be further interrogated – to reveal (through a “hypertext link”) detail/definition etc.
The HNS Browser – was the first demonstrator of the concepts: ‘information modelling’, ‘browsable graphical schemas’, ‘hypergraphics/hypertext’, ‘active and interactive discovery’ and the reduction of complexity (here of the functional anatomy of the human nervous system) and ‘encapsulation’. The computer-based browser was built in 1985 using BASIC, harnessing the power of computers & WIMP; employing ‘active & interactive’ displays e.g. the gradual, incremental composition of a schema from its parts and ‘interrogate and reveal detail’. I did not realise at this time, but it also represented an implementation of the “hypertext paradigm” – but essentially in a visual, graphical (symbolic) way.
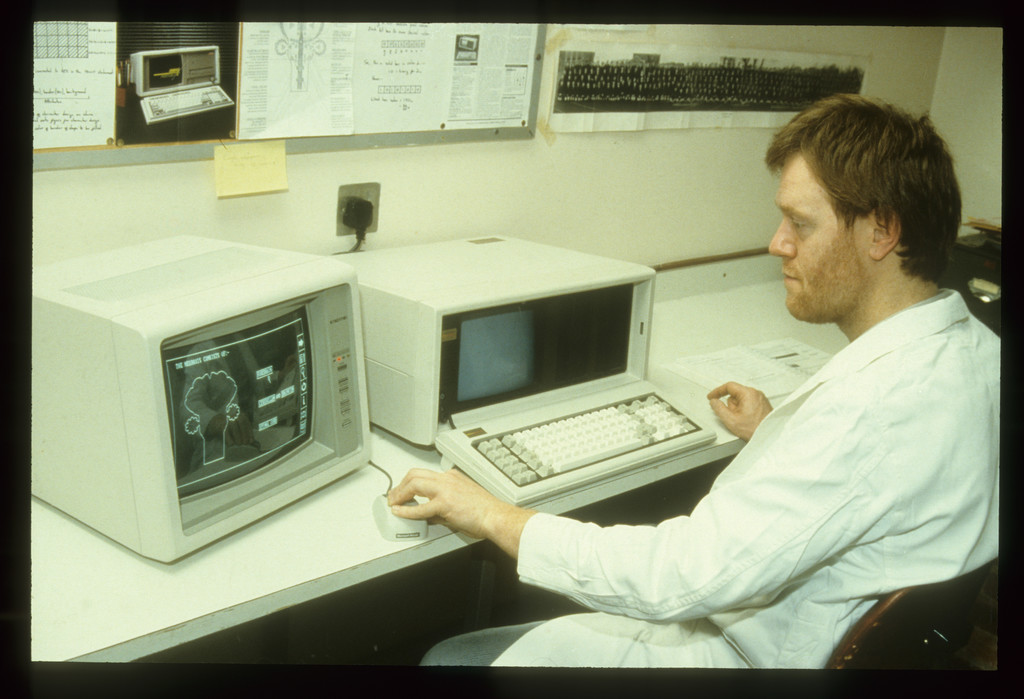
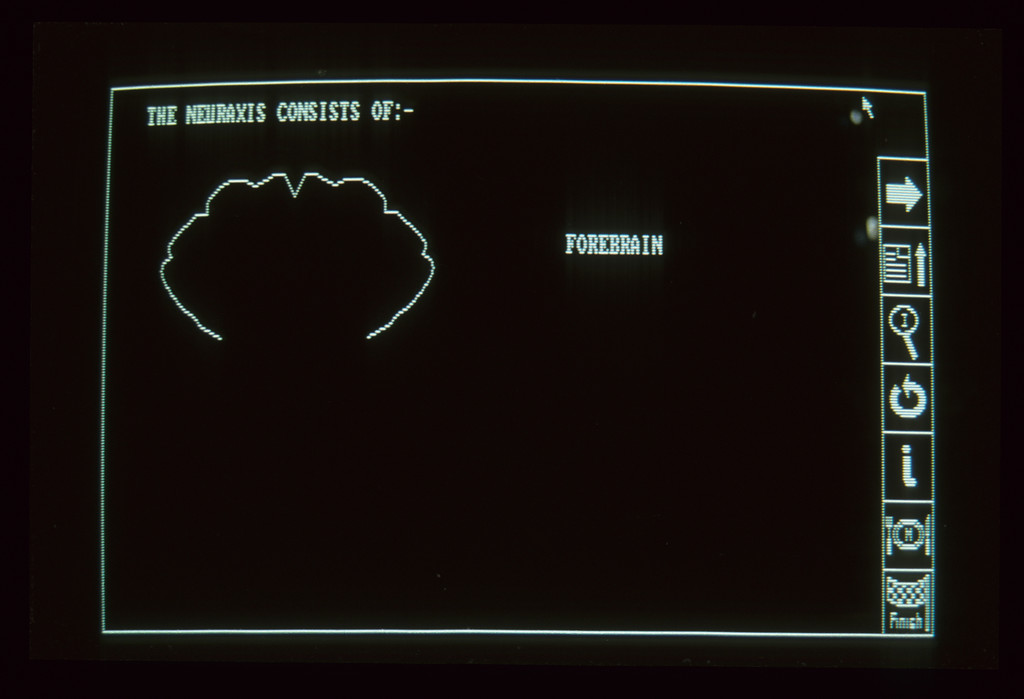
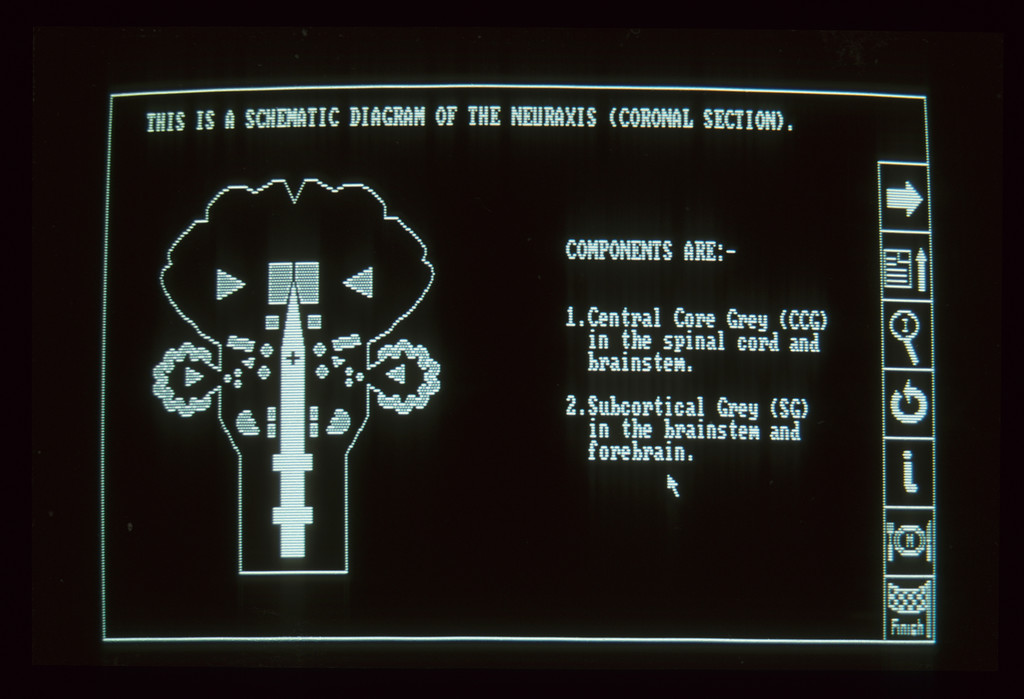
The Neuraxis (outline of Forebrain, Brainstem & Spinal Cord) parts/levels were drawn level by level – stopping at each stage and displaying the equivalent named part/level. The Neuraxis is bilaterally symmetrical and this is essential to understand in order to understand the various pathways – ascending and descending and decussating between the neurons and centres at the various levels.. This outline was drawn on the screen in its two halves – left and right – simultaneously.
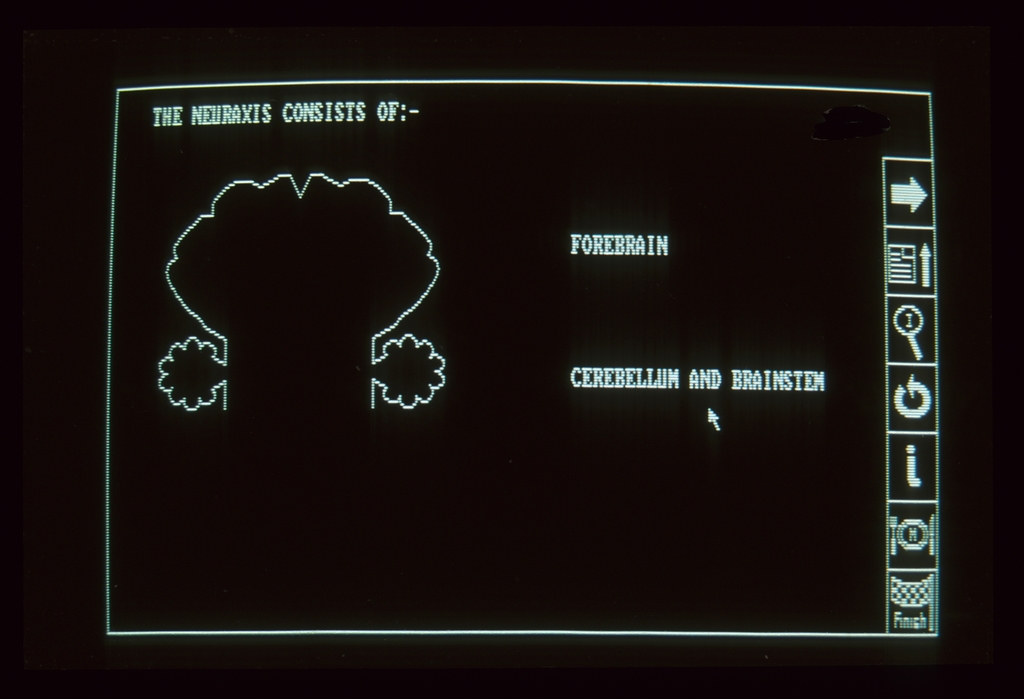
The principal centres (of neurons) were progressively displayed – in the Spinal Cord (here – the CCG Central Core Grey – made up of LMN Lower Motor Neurons and Interneurons) and then in the Brainstem and Forebrain.


A Button: Interrogate – when selected, highlighted (boxes around words) which could be selected (where the mouse pointer changed to a Magnifying Glass and linked to detail/definition/explanation.
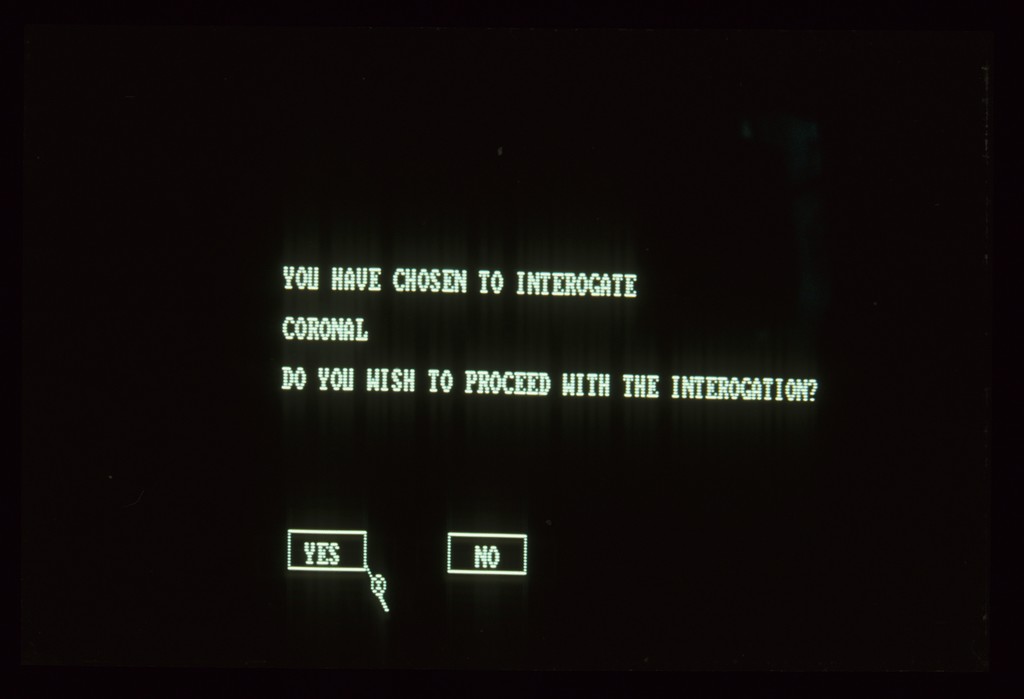
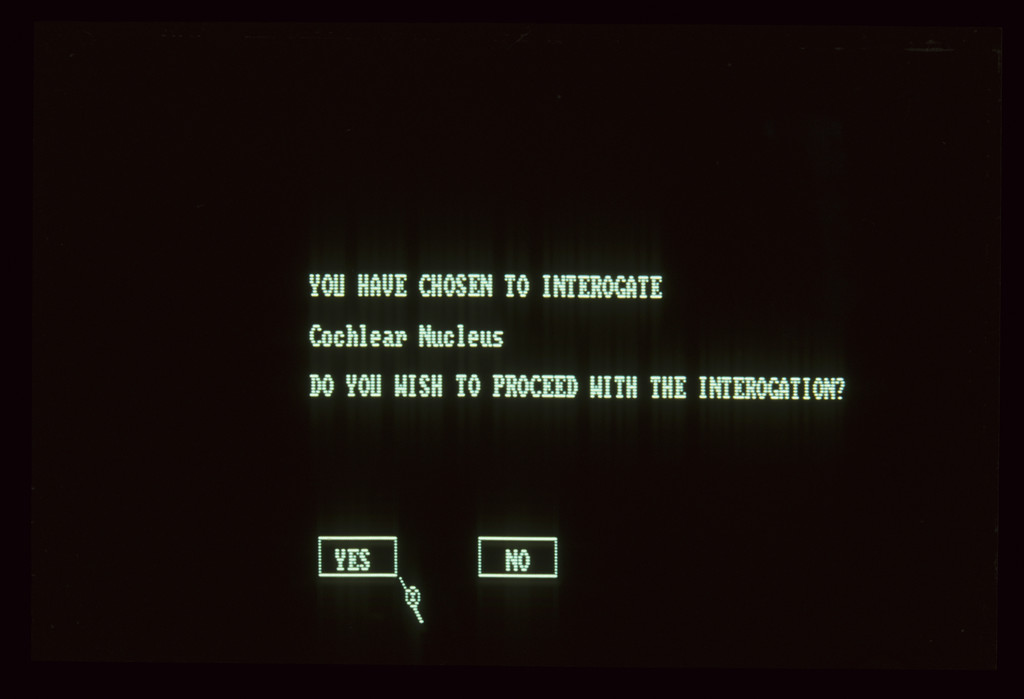
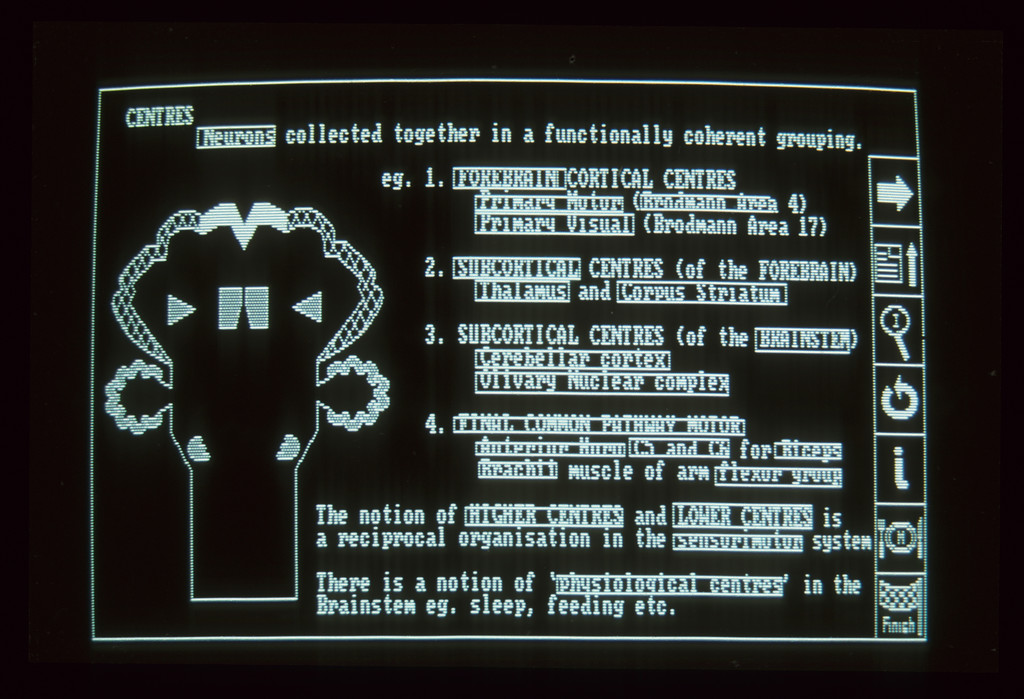
A Button: Interrogate – when selected, highlighted (boxes around words) which could be selected (where the mouse pointer changed to a Magnifying Glass and linked to detail/definition/explanation.

After the construction of the ‘HNS Browser’ on the Compaq Portable Computer (generously donated by Compaq Computers) – as a “Concept Demonstrator” – the aim – when the technology of high-resolution colour displays became available – was to employ colour-coding for the key elements of the CNS Schema. In contact with the IBM Labs in Texas USA, we were provided with the software to display the HNS Schema in colour on one of the early IBM PCs with a colour display card.